smart-city-traffic-analysis
38,310,226 ROWS38.3 million New York taxi trips modelled as a single graph to find where the city's traffic actually bottlenecks. PageRank ranks the critical zones, Louvain finds the communities, and a node-removal simulation measures what breaks when they close. 38,3 milyon New York taksi yolculuğu tek bir graph olarak modellenip şehrin trafiğinin gerçekte nerede tıkandığı bulunuyor. PageRank kritik bölgeleri sıralıyor, Louvain toplulukları çıkarıyor, düğüm silme simülasyonu da bunlar kapandığında neyin bozulduğunu ölçüyor.
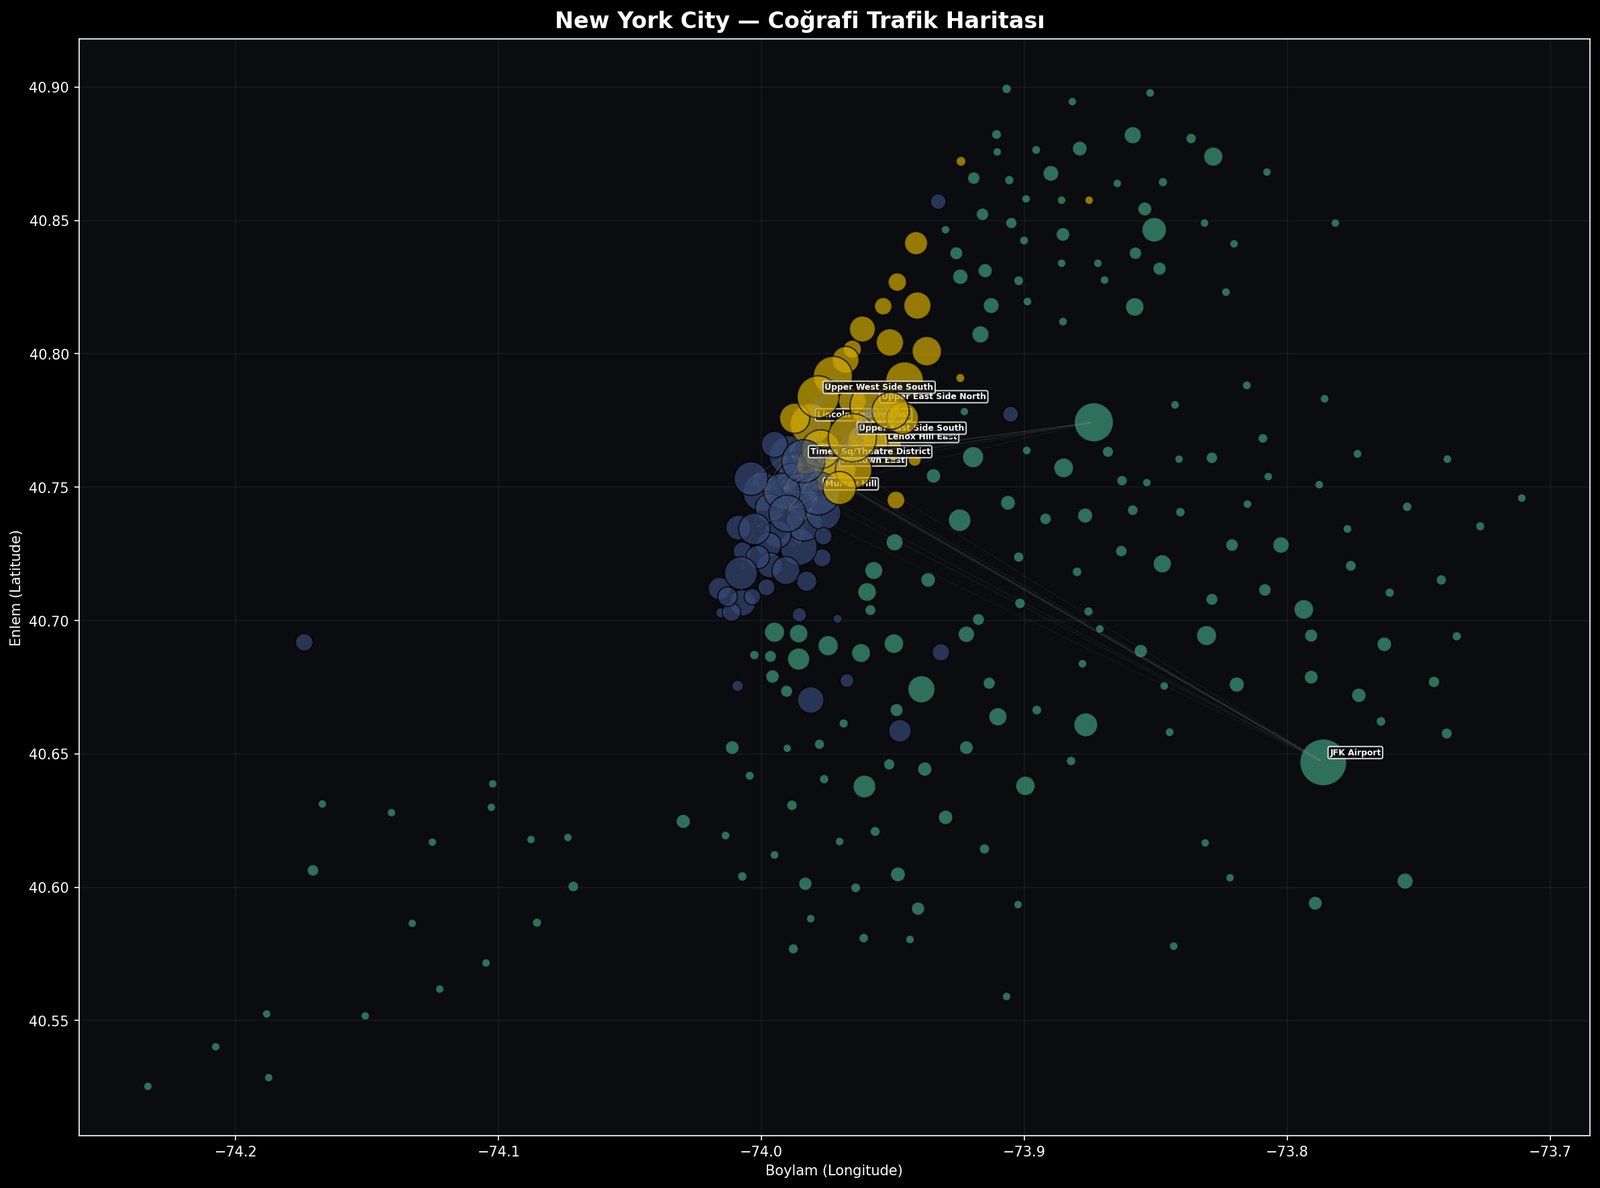
Three communities Louvain found, drawn on their real coordinates. JFK sits far out on its own and still pulls long edges into the Manhattan core — which is exactly why removing it does so much damage. Louvain'in bulduğu üç topluluk, gerçek koordinatlarına çizilmiş. JFK tek başına uzakta duruyor ve buna rağmen Manhattan çekirdeğine uzun kenarlar çekiyor — çıkarılınca bu kadar hasar vermesinin sebebi tam olarak bu.
Walk the network yourselfAğda kendin dolaş
258 ZONES ON THEIR REAL COORDINATESEvery circle is a taxi zone, sized by PageRank and coloured by the community Louvain found; the lines are the 299 heaviest flows between them. Click a zone for its numbers. Then step through the removal simulation and watch what happens at step four. Her daire bir taksi bölgesi — büyüklüğü PageRank'e, rengi Louvain'in bulduğu topluluğa göre; çizgiler aralarındaki en ağır 299 akış. Sayıları için bir bölgeye tıkla. Sonra silme simülasyonunu adım adım ilerlet ve dördüncü adımda ne olduğuna bak.
Nothing removed — the network as it stands.
The simulation removes zones in order of criticality and recomputes the graph each time. Steps one to three cost flow but leave the network whole. Step four is JFK, and the component count goes from one to sixteen — the same finding the static figures below report. Simülasyon bölgeleri kritiklik sırasıyla çıkarıp çizgeyi her seferinde yeniden hesaplıyor. Birinci ve üçüncü adımlar akışa mal oluyor ama ağı bütün bırakıyor. Dördüncü adım JFK ve bileşen sayısı birden on altıya çıkıyor — aşağıdaki durağan figürlerin raporladığı bulgunun aynısı.
Three findingsÜç bulgu
Closing one airport does not slow the network down, it cuts it apart. The graph stops being one connected piece and becomes sixteen. Bir havalimanını kapatmak ağı yavaşlatmıyor, kesip ayırıyor. Graph tek bağlı parça olmaktan çıkıp on altıya bölünüyor.
Removing the five most critical zones one at a time costs just over a third of the flow between them. En kritik beş bölgeyi teker teker çıkarmak, aralarındaki akışın üçte birinden fazlasına mal oluyor.
It has the highest betweenness of any zone at 1.00 while ranking 17th on PageRank. It is a bridge, not a destination — and only one of the two measures sees it. 1,00 ile en yüksek arasındalığa sahip ama PageRank'te 17. sırada. Bir varış noktası değil köprü — ve bunu iki ölçütten yalnızca biri görüyor.
The analysisAnaliz
NYC TLC 2023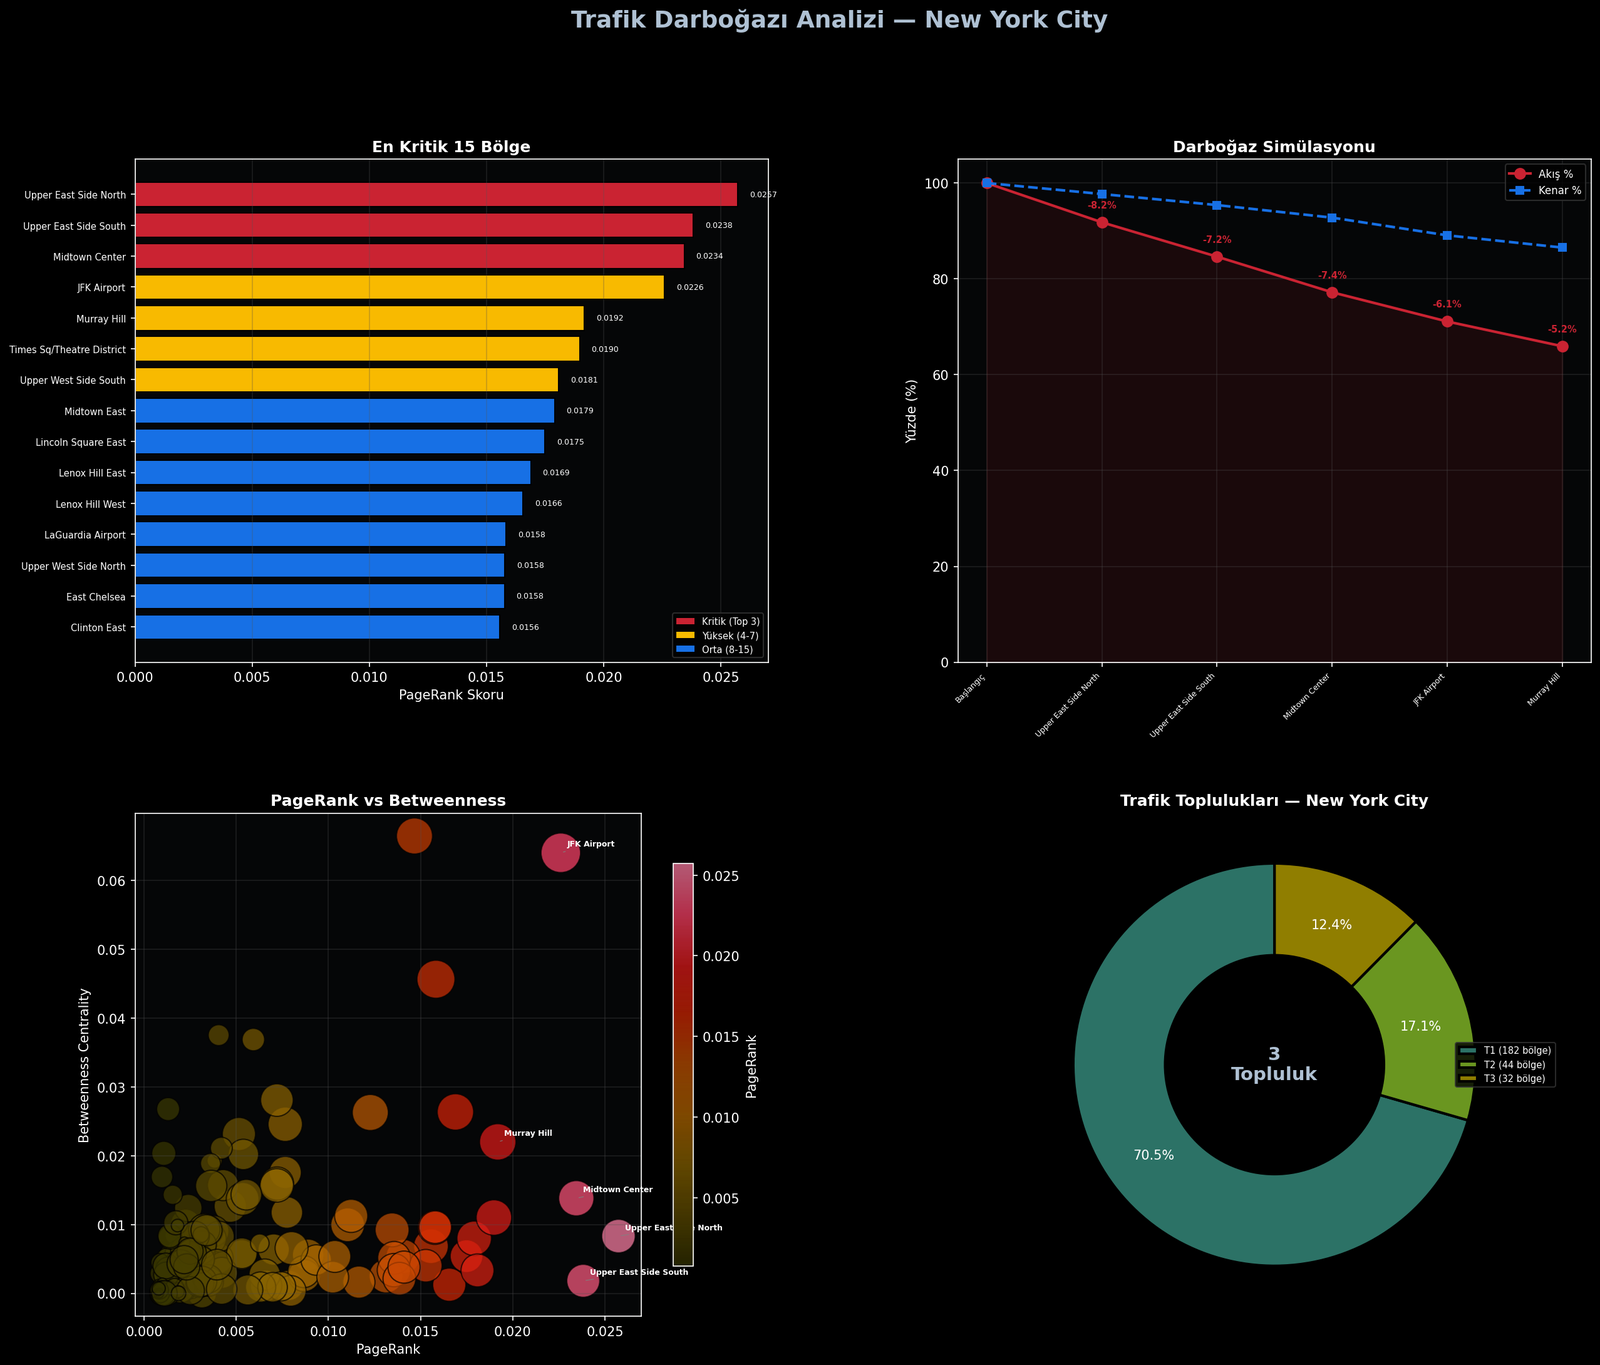
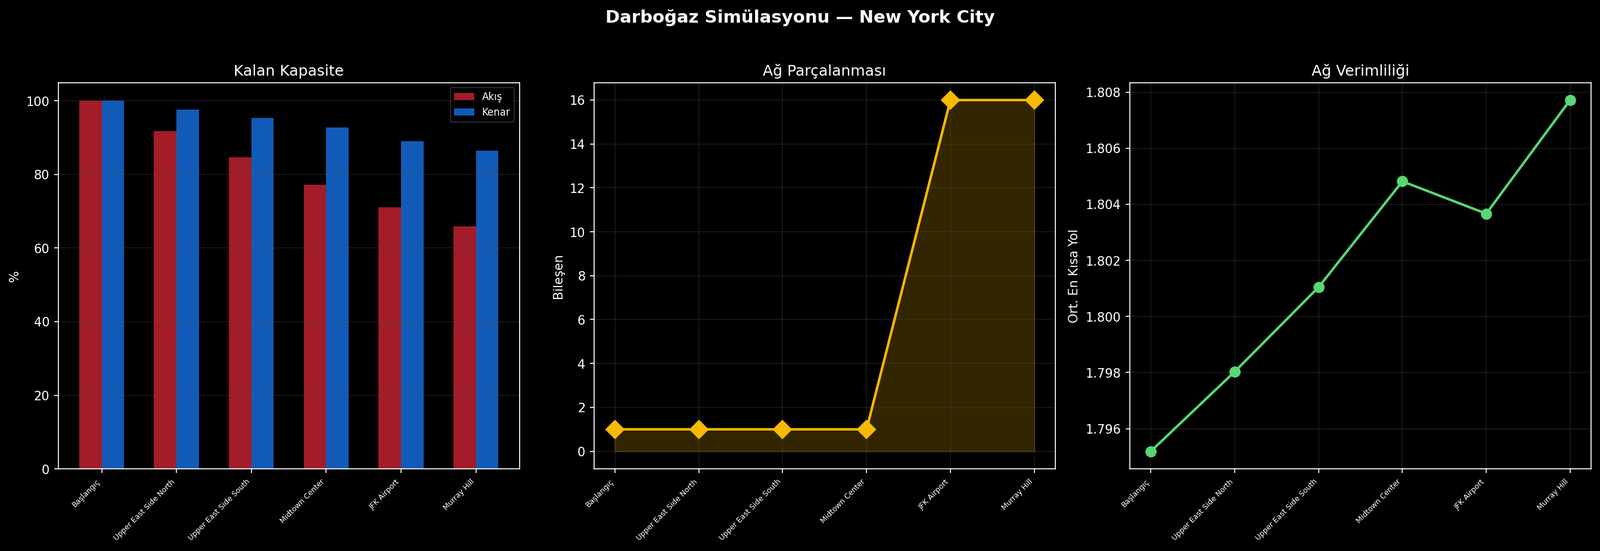
Laptop scale and cluster scale, same code path Dizüstü ölçeği ve küme ölçeği, aynı kod yolu
| Mode | Engine | Data size | Where it runs |
|---|---|---|---|
| Local demo | Pandas + NetworkX | < 10M rows | Laptop / PC |
| Cloud production | PySpark + GraphFrames | 10M+ rows | AWS EMR / Google Dataproc |